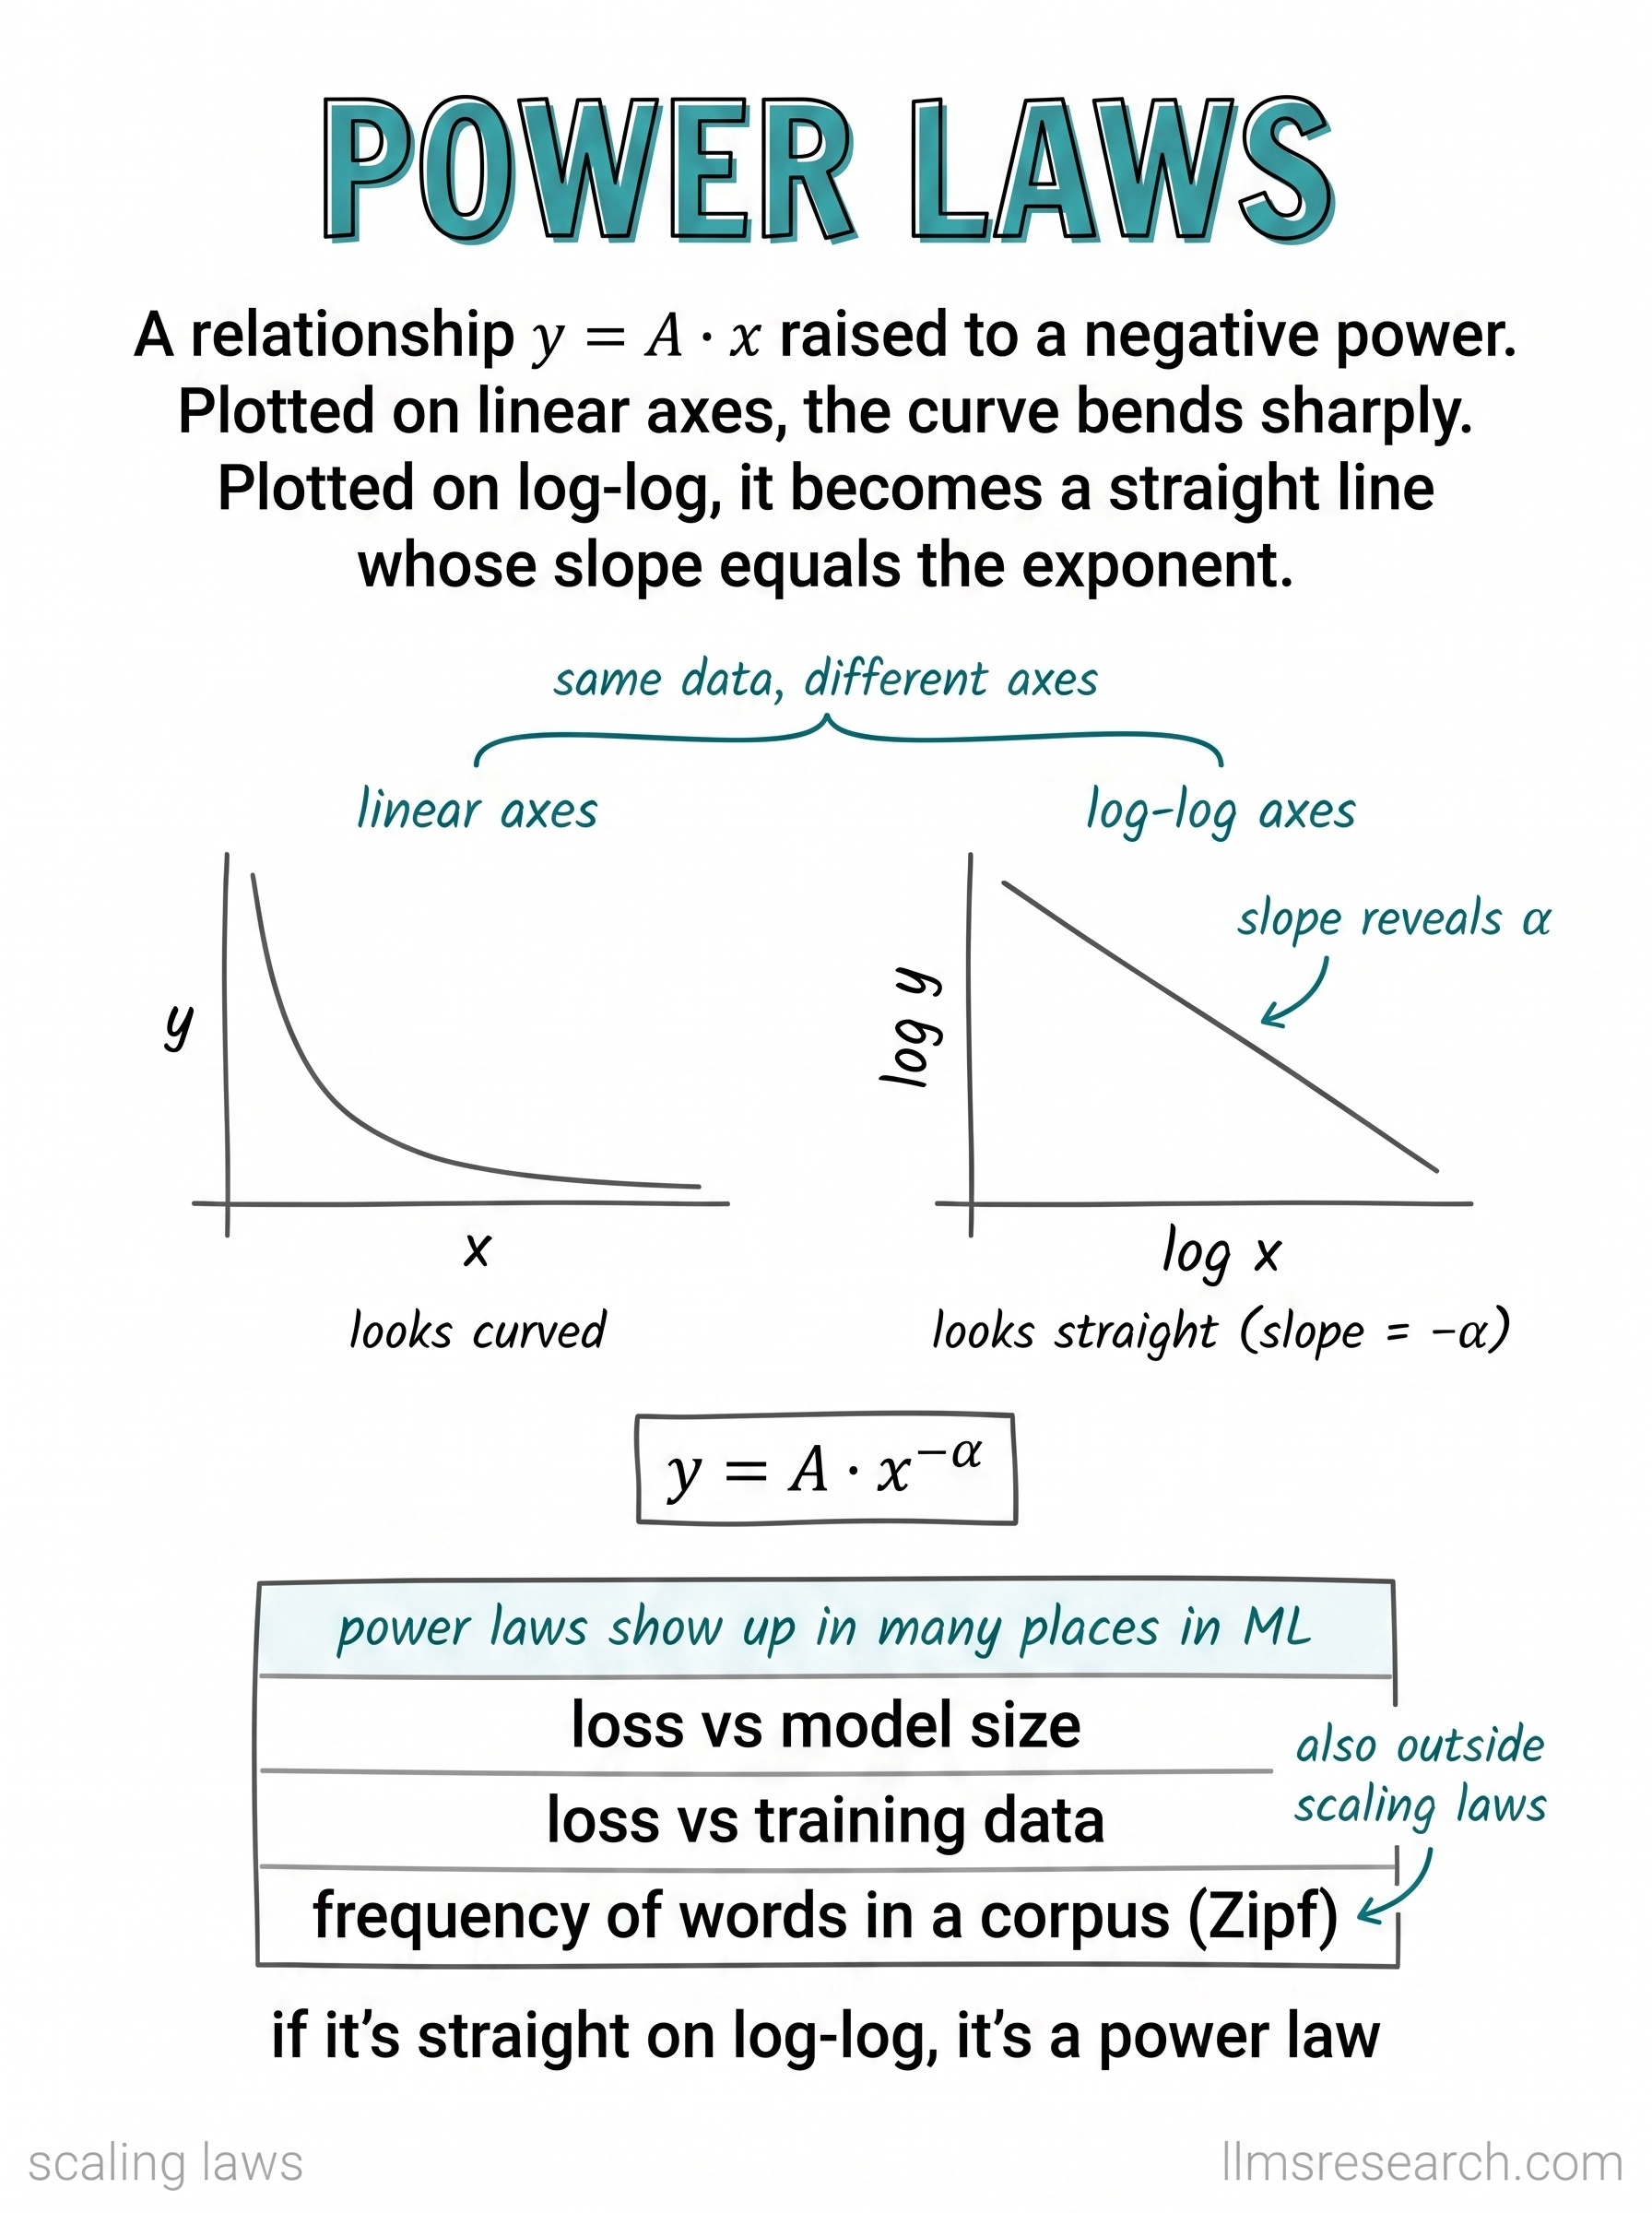
The previous card leaned on the phrase power law without unpacking it. This card is the unpacking. A power law is a relationship where y equals a constant A times x raised to a negative power, written with the exponent alpha. The shape it produces is distinctive: y starts high, drops steeply, then flattens into a long slow tail that approaches zero without reaching it.
The two plots make the central trick visible. On linear axes, drawn on the left, the power law looks like a sharply bending curve, hard to read and easy to mistake for other decaying shapes. On log-log axes, where both the horizontal and vertical scales are logarithmic, the same data becomes a straight line. That is not a coincidence of this particular curve; taking the log of both sides of the equation turns the exponent into a slope, so every power law is a straight line in log-log space and the slope of that line is exactly minus alpha. The card states the diagnostic plainly: if it is straight on log-log, it is a power law.
Reading the exponent off the slope is what makes the plot practical. A steeper line means a larger alpha, which means the quantity falls off faster as you increase x. In the scaling-law setting, that translates directly: the slope of loss against model size or data size tells you how much loss you buy per order of magnitude of scale, which is the number you need to decide whether more scale is worth the cost.
The list at the bottom is a reminder that this pattern is not special to language models. Loss versus model size and loss versus training data are power laws, but so is the frequency of words in a corpus, the Zipf distribution, where a handful of words dominate and a long tail occurs rarely. Power laws turn up across many natural and engineered systems, which is part of why the log-log straight line is worth recognizing on sight. The tokenizer cards touched the same distribution from the other end; here it is one instance of a shape that recurs.